School District Reopening Plans: Trends + Graphs
- James Bacon

- Oct 2, 2020
- 6 min read
Updated: May 20, 2024
Original Post Date: July 24, 2020 | Last Updated: October 2, 2020
As August approaches, so does the start of the fall semester in school districts across the country. But with COVID-19 still present across the United States, districts are having to make decisions about how to start school that they likely haven’t ever had to make before. With little time left, we’re seeing districts make hard decisions about whether to bring their students back fully in-person, continue with entirely virtual instruction, or implement a hybrid model somewhere in between. Education Week has recently started a list of districts across the country and their current plans.
But looking at the raw data makes it tough to draw trends. Because we support schools all over the US with scheduling (of flex periods), like data, and are generally curious, we decided to turn this data into some graphs so we can decipher some trends in what’s happening across the country. We figured many of you, whether you work in a school, have school-age children, attend school yourself, or just want to know what’s going on in our schools, would also find this information interesting. In this post, we share various graphs and charts to help you synthesize the data Education Week was so kind as to collect. We plan to update this weekly and keep the “last updated” date at the top so you can check back here periodically as things continue changing. And if you’ve been checking their list or checking the news, you know things change on a daily basis.
Note on Our Use of the Word"Choice"
While we refer to districts "choosing" how to reopen in this post, we recognize that this "choice" is not always up to the district alone and even made by the state (either the Department of Education and/or the Governor) on their behalf in many cases. Because of that, below, we are including a map of each state's stance on reopening as it concerns any "guidance" or "mandates" for districts within their respective states. The map below is courtesy of Ballotpedia (view the direct link here), which organizes each state's stance into five categories as reported by Education Week's map, which was last updated on September 28, 2020.

Overview of the Data + Context
First, it’s helpful to understand the overall picture. As of the last update (listed at the top of this page), Education Week had data on 911 public school districts, accounting for 19,812,942 students, across all 50 states, Washington, DC, and Puerto Rico. According to the National Center for Education Statistics (NCES), there are roughly 50.8 million students in approximately 13,506 public school districts across the country, so their current list accounts for only ~7% of districts, but approximately 39% of public school students, as they have focused on starting with larger districts in most states (like New York City Schools, with close to 1million students), but the list does include districts of all sizes, with the smallest on the list being Jordan Valley School District in Oregon (serving roughly 60 students). The average district size in their current list is 33,400 students per district (compared to the national average of roughly 3,700 students per district).
Additionally, in the data listed, the median start date for schools to reopen is August 24, 2020, though some districts are starting as early as July 22, 2020 (like Alcoa City Schools in Tennessee) and others as late as September 21, 2020 (like the Boston Public Schools), while some districts, including New York City Schools, are still undecided.
Key Definitions + Methodology (from Education Week)
In addition to understanding how this information fits into the overall context, it’s important to remember the disclaimer that Education Week lists below their list: “District reopening plans are subject to change based on board approvals and state actions at any time.” Additionally, we’ve used the same terms regarding the four categories districts currently fall into, cited below.
Key definitions of reopening plan types:
Remote learning only—no in-person instruction. May include exceptions for special populations of students.
Hybrid/Partial—limited, in-person reopening. May include modifications such as social distancing and student capacity limits.
Full in-person available for all students—full-time, in-person instruction is either the return to school model or an option for all students.
Undecided
Additional Notes (from Education Week):
Reopening date – date listed in district announcement, news report, or district calendar
This data includes public school districts only
National Trends
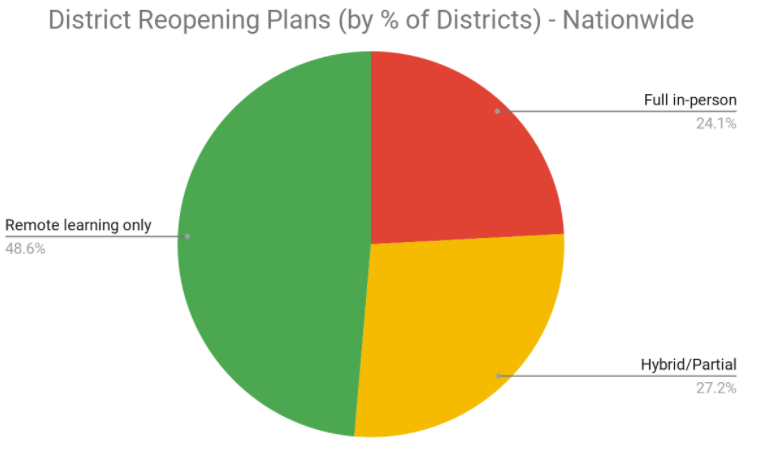
At the national level, it’s helpful to consider trends with this data in regards to the percentage of districts making certain decisions (listed in the first chart below), as well as the percentage of students who will be participating in each option (listed in the second chart). You’ll note that in both charts, remote only is the most popular option, with almost two of every five districts choosing this, accounting for almost half of students. Almost a third of districts are choosing to provide fully in-person options to students, accounting for about a fifth of all students. The hybrid/partial option is less popular currently while about one in five districts is still undecided, accounting for approximately the same percentage of students. Since our last update, districts have become less undecided (reducing from 11.6% to 1.6% to 0.5% to 0% of the sample, after 20.1% being undecided upon first reporting), resulting in slight increases in the remote learning only and hybrid/partial options, whereas in-person has stayed largely the same. However, these changes have increased the percent of students in remote only options from 46% to almost 73%, as more large districts continue to choose remote-only learning.

The discrepancy between the two charts above become more clear as you see the trends based on the size of the district below, where you’ll note our largest districts, often located in more urban and densely populated areas, lean towards remote only options and our smallest districts, likely in less densely populated areas, are over double as likely to choose in-person and less than half as likely to choose fully remote. Since our last update, the percent of districts in each category choosing virtual-only has continued to increase across the board, though marginally. Largely, districts across all categories have decreased in the percent undecided and choosing in-person. Districts choosing the hybrid option have remained relatively steady across all categories, though most saw marginal increases.

In case you’re interested in knowing more about the numbers behind these groups of districts, below is information for how many districts are included in each group, the total number of students accounted for, and the average size of districts in each group. Since our last update, the data set is continuing to add smaller districts, while the top three largest categories have remained largely the same.

Regional Trends
Upon closer look, you’ll also notice that what is happening at the national level does not necessarily represent what’s happening in the various regions of the country. As you’ll notice in the graph below, districts in the West are highly likely to choose online-only options, with most districts having made a decision. On the other end of the spectrum, districts across the South are currently most likely to choose in-person, but are also the most split between remote and in-person, with only a 6 point gap between the two. Districts in the Midwest are currently the most split, with the percentage choosing in-person and remote-only being the same, and only a 3 point difference between those choices the hybrid option. Districts in the Northeast are still the most undecided with a stronger trend toward in-person only emerging. Since our last update, trends within each region have started to level out. The South is now the only region where remote learning is not the most popular choice (with in-person taking a slight lead and all three options being common). In-person is least common in the Northeast as more opt for remote only, much like the West. The Midwest remains largely mixed, despite remote only being the most popular choice.

If you’re curious about the states that make up each region, check out the chart below:

State Trends
For those interested in diving deeper to see states that have strong leanings in any direction (or remain largely undecided), we’ve included a list of the top five states with the highest percentage of districts in each category. We have currently filtered out any states that do not (yet) have at least four districts represented on the list, as a single district’s choice creates large swings in the data. And to find out which districts are included in this data, whether for your state or any other, we recommend using the original Education Week list we're using as our data source (which is sortable by each column header, including state).
Since our last update, each list has remained largely similar, with few states in the top five of each category changing and the percentages within each state choosing that option following suit. The only notable exception is that no districts in any state on this list are undecided, as school has resumed in most places across the country and will start very soon in a few lingering places (primarily in the northeast).

No matter where you’re located, we hope you find it helpful to contextualize what’s happening in your community with the larger landscape across the country. If you’re interested in learning more or getting access to the data we have, feel free to reach out to James at jbacon@edficiency.com and he’d be happy to share more.
And if you’re wondering how to meet the needs of your students as school starts this fall, whether in-person, online, or a hybrid, we’d love to tell you more about how Flex Periods can help. Schedule a call here.
Primary Source Citation:
School Districts’ Reopening Plans: A Snapshot (2020, July 15). Education Week. Retrieved July 24, 2020 from https://www.edweek.org/ew/section/multimedia/school-districts-reopening-plans-a-snapshot.html


Comments